Announcing Promitor v1.0
Promitor v1.0 is now available! This article talks about all the new features & new scrapers.


TL;DR - Promitor v1.0 is now available! This article talks about all the new features & new scrapers.
Today is a big day - After months of work and a ton of contributions, we are finally shipping Promitor v1.0 and is now available on Docker Hub!
Before we take a closer look, let's take a look back!
A trip down memory lane
In 2018 I was working for a Swiss customer where we were migrating message pumps from Azure Cloud Services to Azure Kubernetes Service (AKS). One of the nice things about Azure Cloud Services was that it nicely integrated with Azure Monitor Autoscale which gave us autoscaling out-of-the-box.
Unfortunately, Azure Monitor Autoscale did not integrate with AKS so we had to provide it ourselves, but that's fair. After exploring the autoscaling capabilities of Kubernetes it became pretty clear that a Horizontal Pod Autoscaler was what we needed.
Unfortunately with Kubernetes, you can only scale on built-in metrics such as CPU and you have to use custom metric adapters to scale on external metrics. As of today, you can use the Azure Kubernetes Metric Adapter or KEDA, but in early 2018 this was not the case. The only feasible approach was to use the Prometheus metrics adapter and scale on those. But then another hurdle popped up, how do we get our Azure Monitor metrics in Prometheus? It looked like this was not possible.
On Feb 4th 2018, I gathered all my courage and created the first commit for Promitor and started doing "open-source". Everything was in the wide open and people could log issues and ask for features, but I kept it under wraps for now.
After finalizing the alpha version with just a few scrapers and shitty code, Promitor was announced at Intelligent Cloud Conference and was available for consumption! Over time, more features were added to Promitor while it started to gain traction.
Time passed by and one day I was contacted by Bruno Medina & James Sturtevant from Microsoft Commercial Software Engineering (CSE) to see if I was open for contributions by Microsoft - I was truly honored! In March 2019, I've stayed around after the MVP summit to join the Promitor hackathon hosted by Microsoft to guide MSFTies to add more scrapers, make it more robust and do some product planning.
Since then more and more people started asking for features, reporting bugs, demonstrating how to use it and contribute to Promitor - I could not have imagined that when I started Promitor!
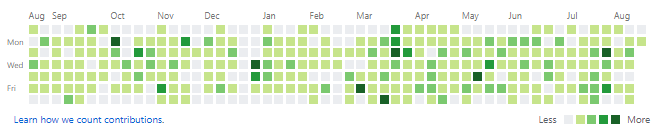
Looking back at my GitHub activity the least I can say is that it's been a very busy year and more than happy to release Promitor v1.0!
What's New?
Promitor v1.0 brings a lot of new features and makes it easier to operate it.
As of now, Promitor is available on Docker hub via a new Docker image:
docker pull tomkerkhove/promitor-agent-scraper
Going forward, all new releases will be done for this image and tomkerkhove/promitor-scraper will no longer be updated.
Let's have an in-depth look at our new features!
Simplified deployment on Kubernetes
We provide a Helm chart to simplify deployments on Kubernetes which is available on Helm Hub.
You can easily easy deploy it in a few commands:
$ helm repo add promitor https://promitor.azurecr.io/helm/v1/repo
$ helm install --name promitor-agent-scraper promitor/promitor-agent-scraper \
              --set azureAuthentication.appId='<azure-ad-app-id>' \
              --set azureAuthentication.appKey='<azure-ad-app-key>' \
              --values /path/to/metric-declaration.yaml
Now you no longer have to worry about configuring everything on Kubernetes - Just focus on your metrics, we've got this!
Learn more about deployments in our documentation or use our new walkthrough.
A new way of managing the runtime
As Promitor grows, so does its configuration. Over time we've been adding knobs to tweak Promitor to behave as customers wanted, but that ended up with a big amount of environment variables which was not ideal.
As of Promitor v1.0, you can configure the Promitor via a runtime YAML which needs to be mounted to /config/runtime.yaml.
The beauty is that you can now add the runtime configuration to source control and incorporate it in the review process!
Next to that, you can now control how unavailable metrics are being reported. By default, we'll use NaN but you can use whatever you want!
Here is a full example of the configuration:
server:
  httpPort: 80 # Optional. Default: 80
prometheus:
  metricUnavailableValue: NaN # Optional. Default: NaN
  enableMetricTimestamps: false # Optional. Default: true
  scrapeEndpoint:
    baseUriPath: /metrics # Optional. Default: /metrics
metricsConfiguration:
  absolutePath: /config/metrics-declaration.yaml # Optional. Default: /config/metrics-declaration.yaml
telemetry:
  applicationInsights:
    instrumentationKey: ABC # Optional. Note: Required to be specified when turned on
    isEnabled: false # Optional. Default: false
    verbosity: trace # Optional. Default: N/A
  containerLogs:
    isEnabled: true # Optional. Default: true
    verbosity: trace # Optional. Default: N/A
  defaultVerbosity: error # Optional. Default: error
Learn how to configure Promitor runtime in our documentation.
A more flexible approach for scraping metrics
The existing metrics declaration format was a bit verbose and only limited to one resource group which was forcing you to spin up a Promitor instance per resource group.
In Promitor v1.0 we've enhanced our approach:
- Introduction of a spec version allowing us to make breaking changes without having to break existing customers
- Support for scraping multiple resources reporting under the same metric name which come with detailed information on the labels. This allows you to have a
queue_lenghtmetric for all your queues instead of forcing unique names if you wish to. - Introduction of
resourceGroupNamewhich allows you to scrape a different resource group than what is defined inazureMetadata.resourceGroupName - Introduction of metric defaults which are applied to all metrics, unless they are configured otherwise. This can be used to define the scraping schedule & aggregation interval.
- Use different scrape schedules per metric to have more dynamic metrics, backed by a default schedule
Here is an example of the new metric declaration format:
version: v1
azureMetadata:
  tenantId: xxxxxxxx-xxxx-xxxx-xxxx-xxxxxxxxxxxx
  subscriptionId: yyyyyyyy-yyyy-yyyy-yyyy-yyyyyyyyyyyy
  resourceGroupName: promitor
metricDefaults:
  aggregation:
    interval: 00:05:00
  scraping:
    # Every minute
    schedule: "0 * * ? * *"
metrics:
  - name: azure_service_bus_active_messages
    description: "The number of active messages on a service bus queue."
    resourceType: ServiceBusQueue
    labels:
      app: promitor
      tier: messaging
    scraping:
      # Every 2 minutes
      schedule: "0 */2 * ? * *"
    azureMetricConfiguration:
      metricName: ActiveMessages
      aggregation:
        type: Total
        interval: 00:15:00
    resources:
      - namespace: promitor-messaging
        queueName: orders
      - namespace: promitor-messaging-dev
        queueName: orders
        resourceGroupName: promitor-dev
You can find a full overview in our documentation.
- New metric declaration format
- metricDefaults?
New Azure scrapers
Up until today Promitor already supported scraping the following Azure services:
If that wasn't good enough for you, you could also use the more advanced Generic scraper which allows you to scrape any Azure resource.
Promitor v1.0 brings a lot more scrapers which makes it more convenient to scrape metrics:
- Azure Cache for Redis
- Azure Container Instances
- Azure Container Registry
- Azure Cosmos DB
- Azure Database for PostgreSQL
- Azure Network Interface
- Azure Virtual Machine
You can find a full overview in our documentation.
Better support for metric labeling
One of the most powerful features of Prometheus are labels - They allow you to use one metrics for different systems but differentiate them via additional context information in the labels.
This was an area where Promitor was not doing a good job, so we've improved it!
Every metrics that will be scraped will now include built-in labels (resource_uri, subscription_id, resource_group, instance_name) along with scaler-specific labels, depending on the scaler you are using.
Last but not least, you can enrich metrics with by bringing your own labels with custom label! This allows you to assign any fixed value to a metric in the metric declaration.
You can read more about it in our labeling documentation or learn how to configure custom labels.
Introducing system metrics
Since Promitor relies on Azure Resource Manager (ARM) API, we've decided to give full insights on how we are doing in terms of throttling.
Promitor now exposes a promitor_ratelimit_arm metric which reports the number of remaining calls before Azure throttles us. The metric is reported with the tenant_id, subscription_id & app_id labels.
Learn more about it in our documentation.
Improved Operation Controls
It's important to know how Promitor is doing and, frankly, we did not do a good job at that.
With Promitor v1.0 we are introducing:
More control over telemetry that is being emitted (docs) - We've now merged all telemetry configuration and use multiple sinks for telemetry. As of today Application Insights currently only supports exceptions but this will change in one of our next releases.
You can now also control the default verbosity via telemetry.defaultVerbosity which is will not exceed. This allows you from drowning in the logs.
Here is the new configuration overview:
telemetry:
applicationInsights:
  # [...]
containerLogs:
  # [...]
defaultVerbosity: error # Optional. Default: error
Based on customer demand we can add more sinks, so don't hold back and request it!
Health endpoint now provides more detailed information (docs) - While we've introduced the endpoint already in v0.4.0, this feature will return a payload that gives more information. Currently it's very limited but later on, we will provide information about our dependencies.
New API endpoint for getting runtime configuration (docs). This allows you to now programmatically access the runtime configuration and the metric declaration via REST APIs allowing you to automate processes or give insights to other teams.
Maturing Our Product Management
Promitor v1.0 is also a milestone from a product management perspective as we've done some work around the model of it.
CLA
We have added a Promitor Contribution License Agreement (CLA) that has to be signed by every contributor.
This allows us to make sure that everyone has the same expectations and agrees we can use their code as part of the product.
Security
We value security and want to do our best to keep Promitor as secure as possible.
To make sure everything is clear, we have added a small note on the supported versions and how to report vulnerabilities. Every pull request will also be automatically scanned by Snyk to see if it's adding new vulnerabilities or not.
Once vulnerabilities are fixed, they will be patched and pushed to the existing tags for all our supported versions so it's important you read about our image tagging strategy. While image digest pinning is the most secure way of pulling images, we suggest to use the {major}.{minor} or {major}.{minor}.{patch} tags to always run the latest & secure versions.
Want to know more about it? Get in touch!
Support
Support is a question that comes up now and then, so we want to be explicit - There is no free lunch.
Promitor is free to use and comes with best-effort support, however, we will do our best to patch issues as quick as we can! We are also open for contributions, but be sure to check our contribution guide first.
Learn more about it in our README.
Donations
Promitor is fully OSS and built free-of-charge, however, if you appreciate my work you can become a GitHub Sponsor. You can choose from getting your name and/or company listed up to becoming a roadmap advisor or get dedicated support.
I have hesitated for a long time if we should do this because I do not want people to think I'm in it for the money since that is not the case! However, I've decided that if people would like to support the product or want to show some sort of appreciation they should be able to do so.
Learn more about donations here.
Conclusion
It's been a wild adventure since I've started Promitor but it has been a fun ride and I'm sure this is not the end! I've started the project because it felt like a big gap in Microsoft Azure and unfortunately it is still case as of today. However, I'm happy to keep on closing it as much as I can and I'm happy we've shipped v1.0 today!
Promitor v1.0 brings a lot of new features and gives you more scrapers, control, enriched metrics, and simplified deployment!
I cannot thank everybody enough for their contributions, feature requests and feedback that has made Promitor what it is today!
Interested to contribute as well? Come over and join the conversation or help out on one of our issues!
New to Promitor? No worries, we now have a nice walkthrough which deploys Promitor, Prometheus & Grafana that takes you through the process! Kudos to Lee Cattarin for contributing this!
Thanks for reading,
Tom.