Autoscaling Awareness in Azure
Learn how you can standardize on Azure Event Grid as your centralized autoscaling hub and build an autoscaling-over-time dashboard.


Recently, I have launched Azure Autoscaling Toolbox - Your one-stop shop for all things autoscaling in Microsoft Azure.
But, autoscaling is more than scaling - You need to understand how your autoscaling is doing, adapt and improve but before you can do that you need to ensure you have autoscaling awareness.
Awareness can give insights in different forms:
- Get notified when a scaling action is occurring
- Be able to understand when scaling actions have happened in a given timeframe
- See how your platform is autoscaling over time
Without it, it is hard to troubleshoot issues after the fact or try to make your platform more cost-efficient.
That’s why I’ve introduced a section on autoscaling awareness on Azure Autoscaling Toolbox to help you incorporate it in your platforms and simplify the process for you.
Using Azure Event Grid as your centralized autoscaling hub
Azure Monitor autoscale is a good example of how to do it right - You can receive emails or webhooks, see an over-time dashboard, and have a log of every scaling action that has occurred.
However, not every autoscaler is so feature-rich and most probably you will have to work around it to achieve the same if you can even make it happen at all.
Given those facts, I’ve started to recommend designing a standardized autoscaling strategy for building awareness around your autoscalers on top of Azure Event Grid.
By doing so, it becomes your centralized autoscaling hub and can easily be integrated into your platform by relying on CloudEvents, an open standard that is part of the CNCF.
By using the Kubernetes Event Grid Bridge, all Kubernetes events are automatically forwarded to Azure Event Grid as CloudEvents. These events are even interpreted and emitted as consumer-friendly events so that you don’t have to parse them yourself.
While Azure Monitor Autoscale already provides webhooks out-of-the-box, it is still recommended to plug it into Azure Event Grid as well to streamline the process. You can use a simple Azure Logic Apps as an Azure Event Grid adapter for Azure Monitor Autoscale.
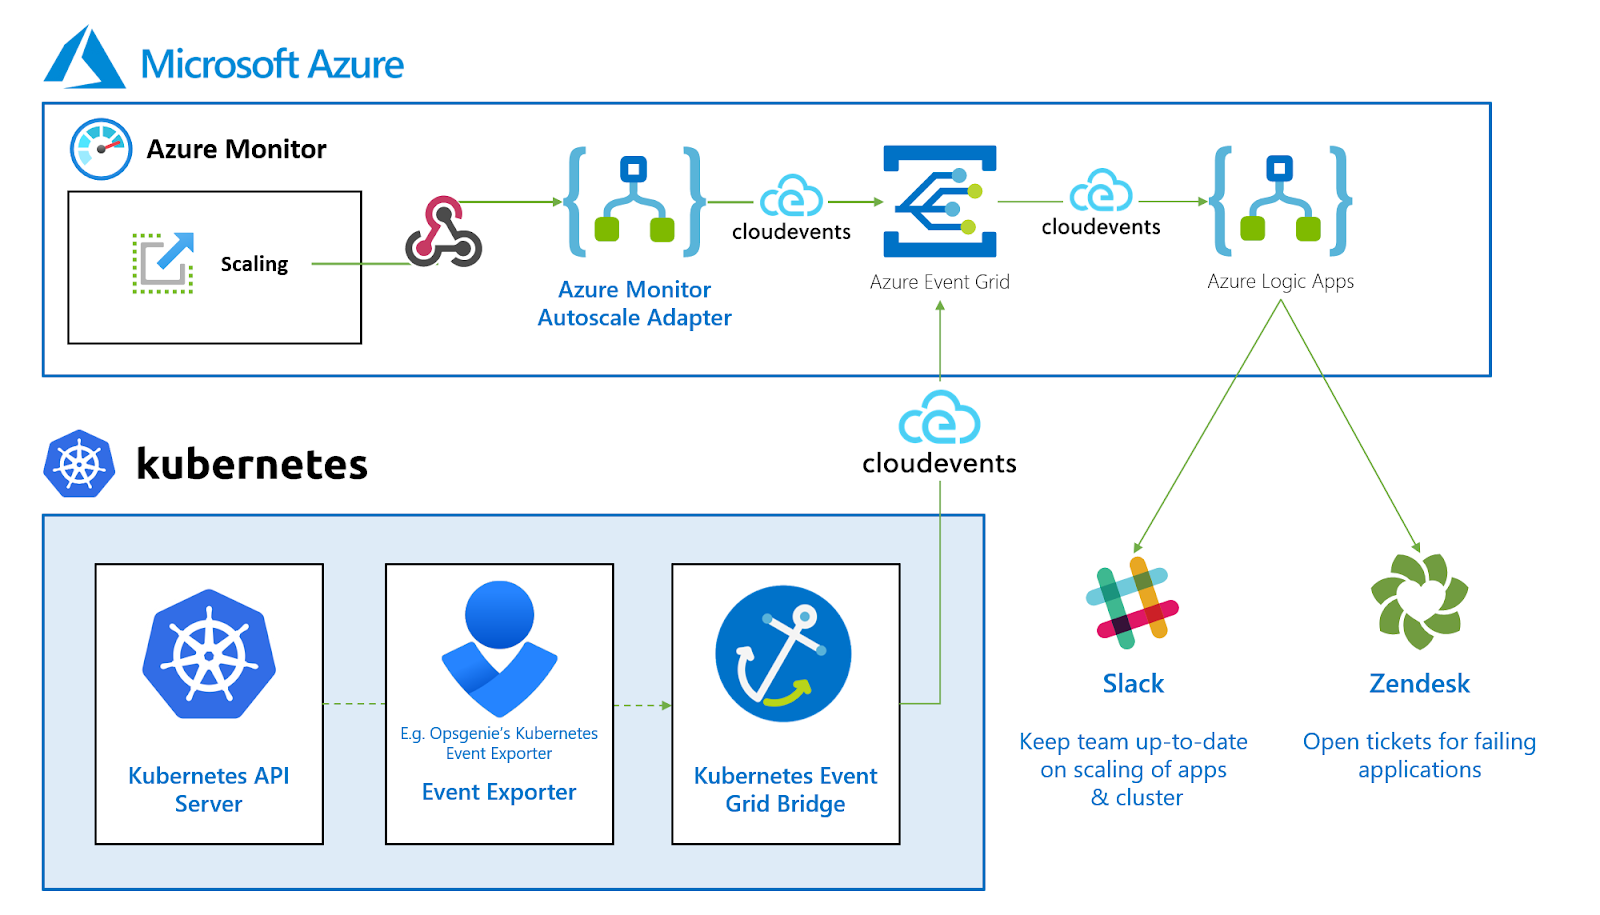
Once they are in Azure Event Grid, you can easily react to them. For example, by sending your notifications to Slack or Zendeck by using a simple Azure Logic App!
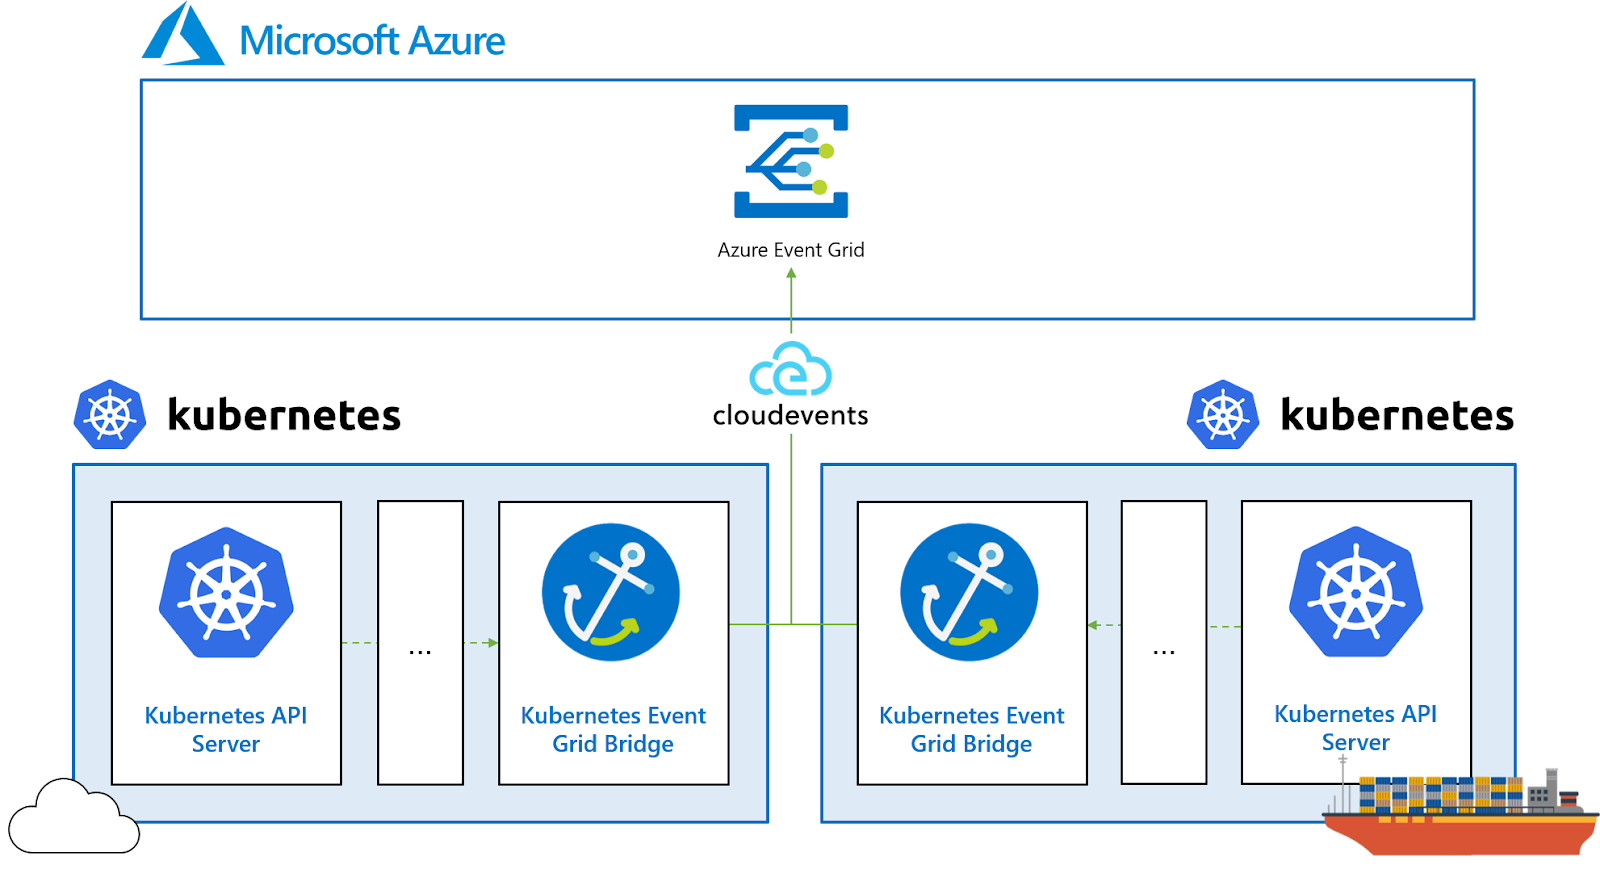
Are you running multiple Kubernetes clusters in Azure or practically anywhere? You can all connect them to Azure Event Grid and monitor them from the cloud!
With this foundation in place, you can do anything - For example, build an autoscaling dashboard that shows all your application instances across your platform!
Building an Autoscaling-Over-Time Dashboard
During the past couple of months, I’ve had numerous cases where I needed to understand how our platform was scaling over time or how many instances we had running at a given point in the past.
While this is not available in Azure out-of-the-box, you can easily build a dashboard yourself by using Azure Functions & Azure Application Insights.
It provides an App Instances metric which reports the instance count every 5 minutes as you can see here:
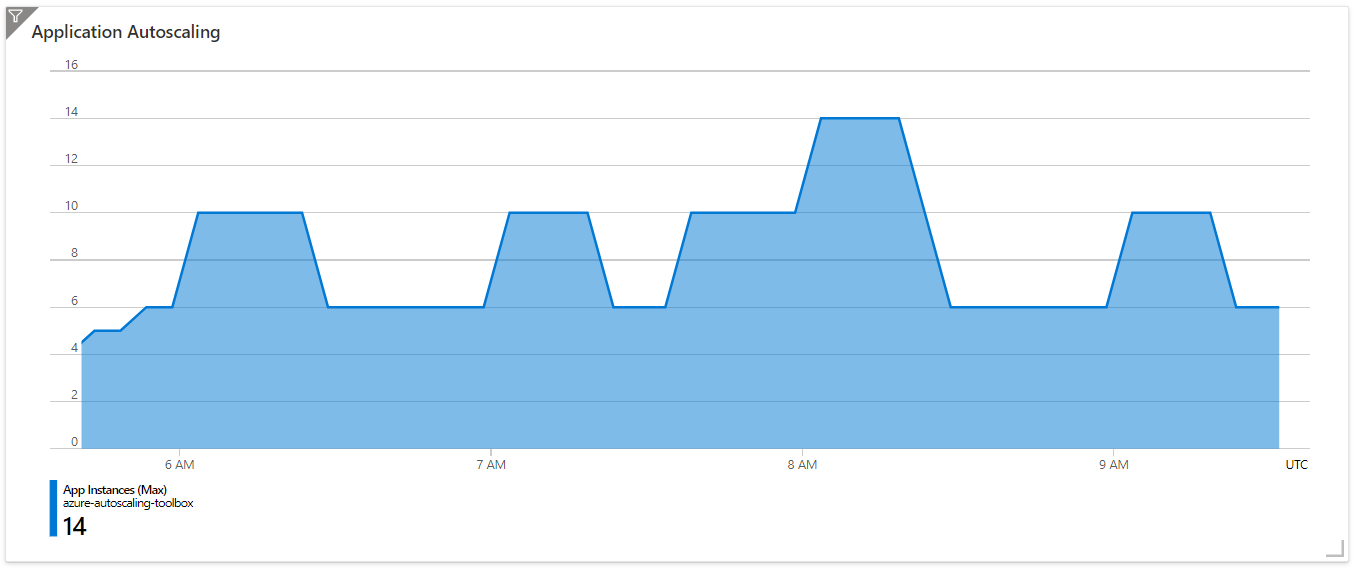
While this is a good start, it is at a very high level and we are only scratching the surface.
This is where the various dimensions of the metric come into play to make it more powerful.
The AppName dimension allows you to have an overview of all instances per application in your platform:
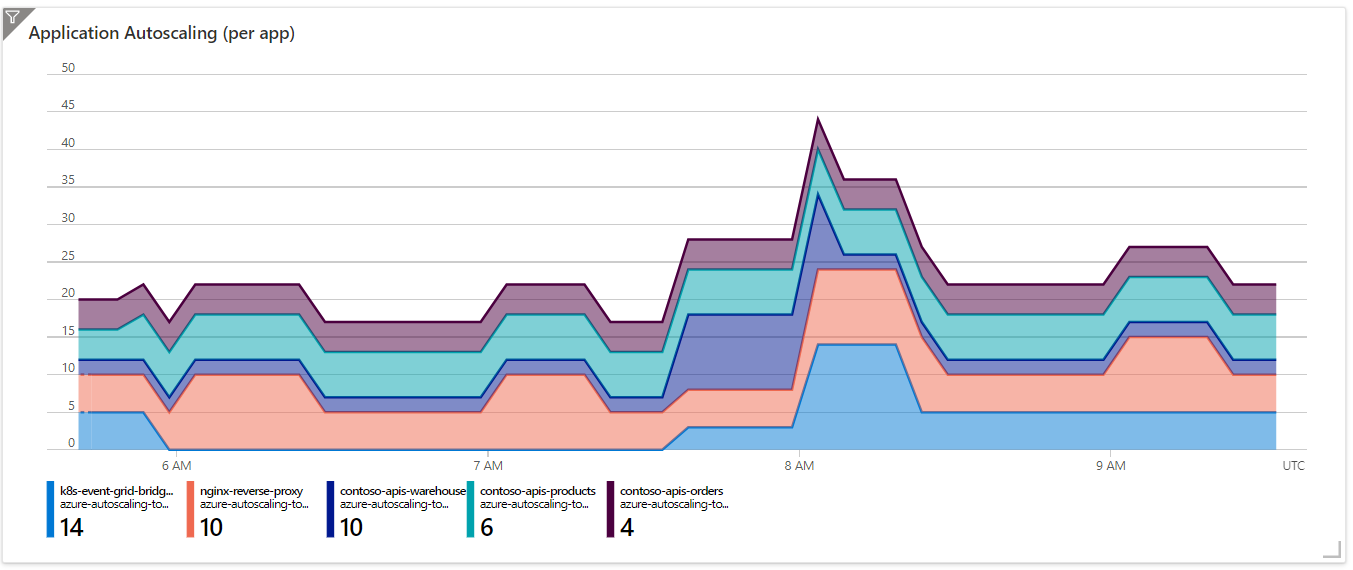
This gives you an idea of what applications are busier than others or where you can potentially save more cost than in other places.
Next, you can see all instances per Kubernetes namespace by using the Namespace dimension:
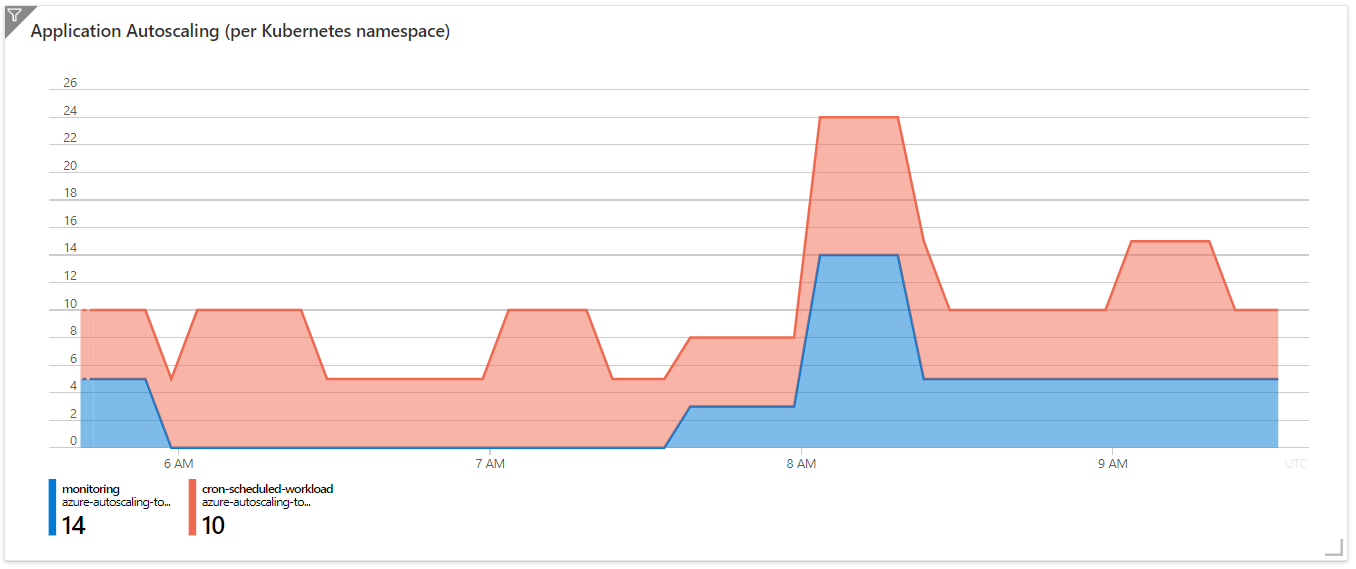
This allows you to understand the ratio of instances per namespace to improve your resource quotas per namespace.
Lastly, the Runtime dimension allows you to understand where most of your instances are running across Azure.
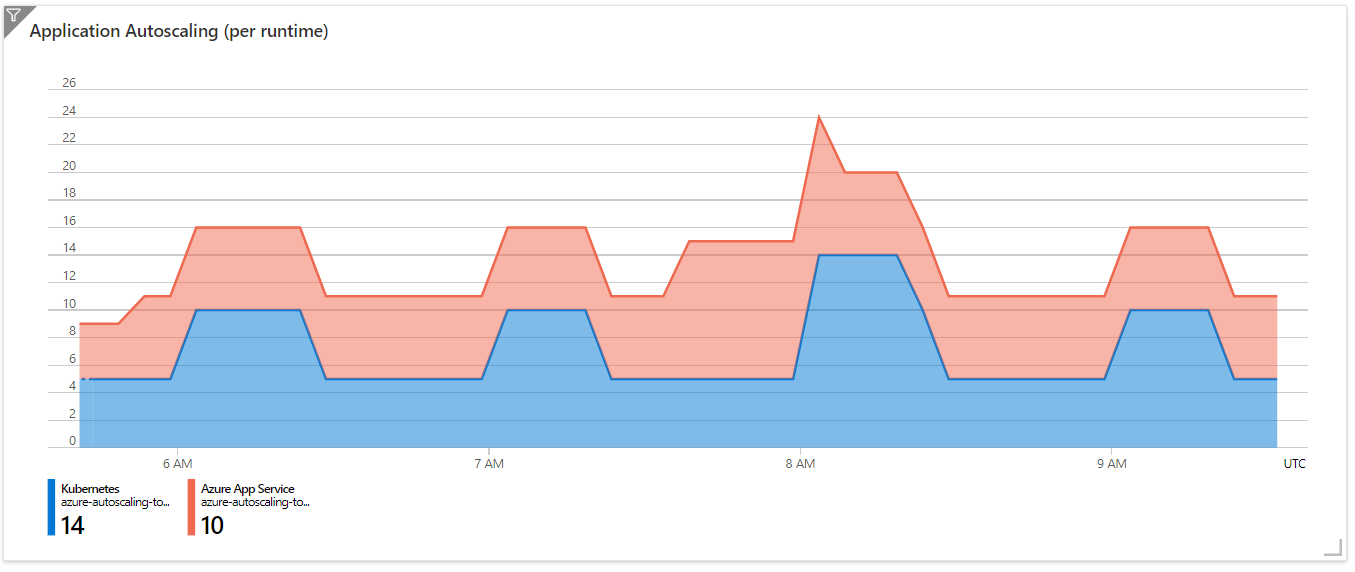
But this is just the start! The more dimensions that are available, the more powerful the metric is.
If you want to get started, this sample is available on GitHub and supports Kubernetes & Azure Monitor Autoscale.
How does it work?
Azure Application Insights is super powerful for building observability into your platform! Because of this, I’m using Arcus Observability with Serilog to write custom metrics with a variety of dimensions when receiving events from Azure Event Grid in an Azure Function.
This allows you to easily build a scatter chart indicating the instance counts for your apps when you are receiving scaling events. This is a good start because now you can go back in time to see when a scaling action occurred, but you don’t see a nice area chart of all instances at a given point in time.
Enter Durable Entities - An easy way in Azure Functions to keep a state for a given entity which you can model functionally (but it is different from the actor model though).
In our scenario, every application in the platform will have a representation as a durable entity that keeps track of its current instance count along with some metadata.
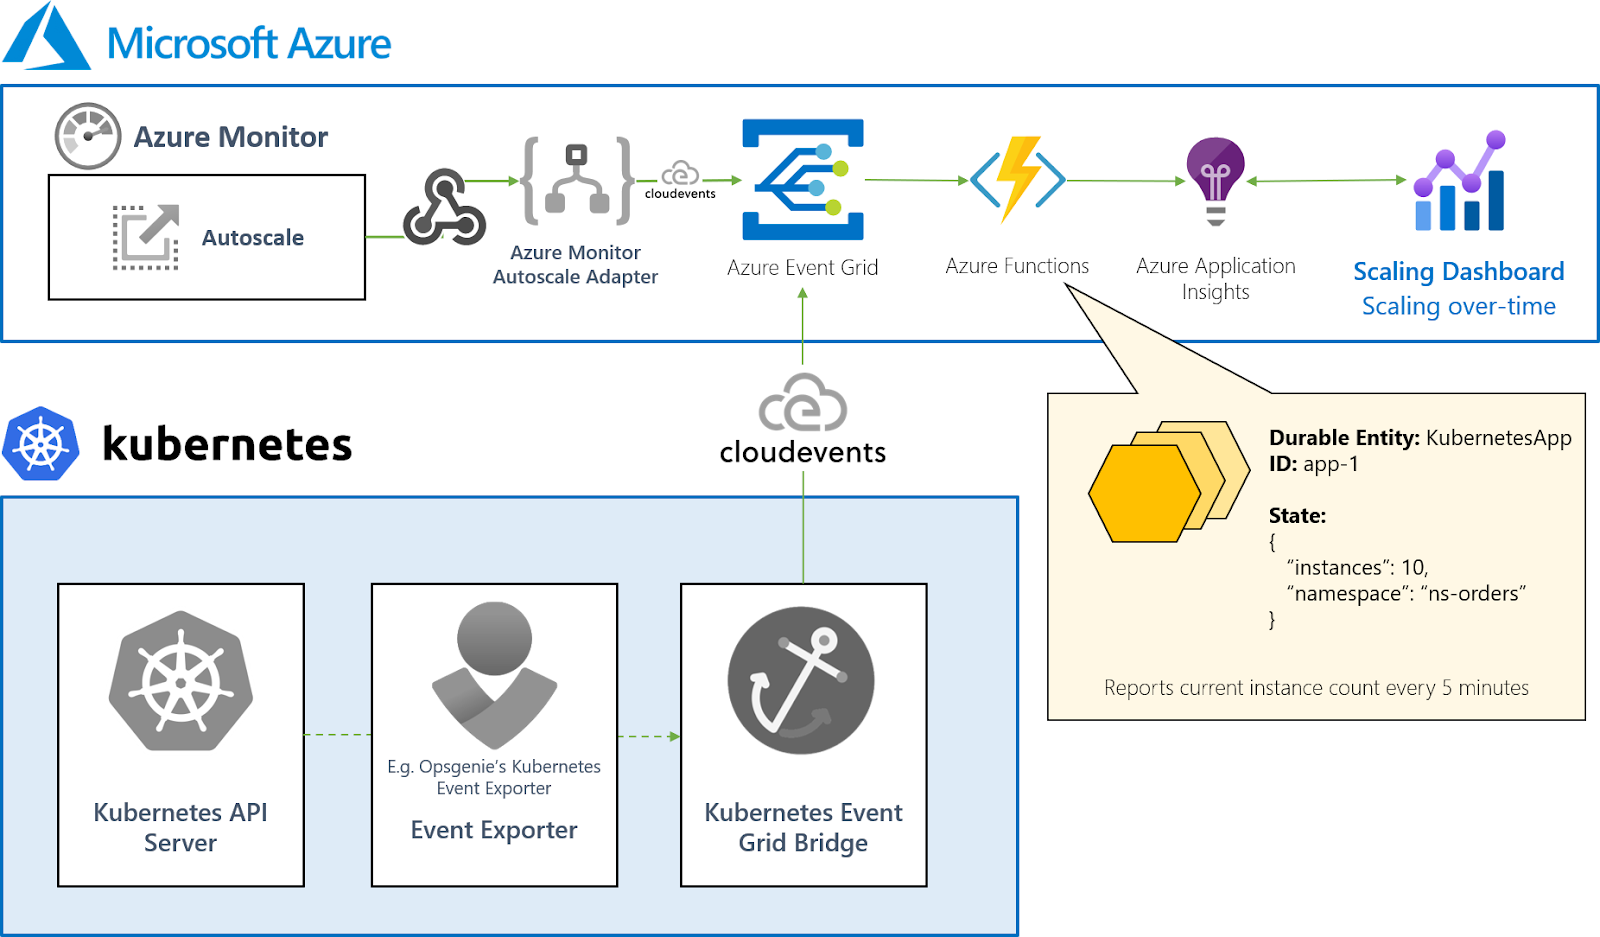
By doing so, we can report the current instance count for all applications in the platform every 5 minutes by using a simple Timer-trigger.
Since the state is persisted, you can even build APIs for people to interact with it and even trigger scaling actions if you want!
I’ve never used Durable Entities up until now, but I have to say that they are very straight forward and nice to work with.
So, how are you staying up to date with all your autoscaling? What awareness do you have? Let me know in the comments.
Thanks for reading,
Tom.