Monitoring Azure Service Bus entities with Azure Monitor - Where did my messages go?


TL;DR - Azure Service Bus metrics in Azure Monitor have a lifetime. If your entity goes idle, Azure Monitor will start showing '0' as a value after 2 hours.
Promitor has been a side project that I've been working on for a while which allows you to scrape Azure Monitor metrics and expose them to Prometheus - More on this later.
Basically it is using the Azure Monitor REST APIs to query for a metric and a given Azure resources, currently only supporting Azure Service Bus queues.
While I was testing I started noticing that Promitor was reporting the following:
# HELP demo_queue_size Amount of active messages of the 'myqueue' queue
# TYPE demo_queue_size Gauge
demo_queue_size 0
That's odd - Why does the Azure Portal show this then?
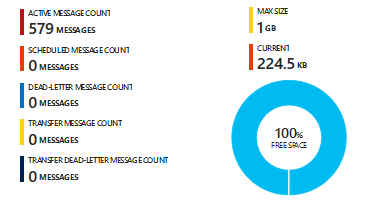
Where did my messages go?
After checking with Microsoft we've noticed that once there was interaction with the entity it started showing metrics again in Azure Monitor:
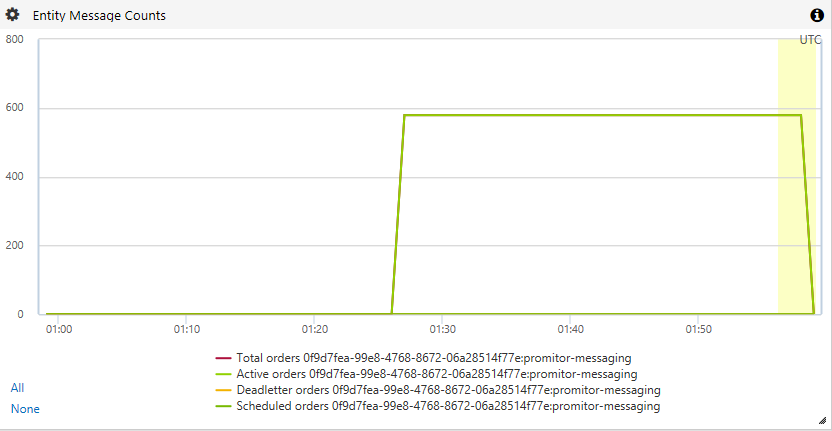
Good news - My messages are right where I left them! When I checked with the team they mentioned that this behavior is actually by design.
Azure Service Bus will stop sending metrics to Azure Monitor when your entity has been idle for more than 2 hours.
Conclusion
A very tricky thing to have but something that you need to be aware of! In my case this was the case as I ony created a queue with messages so that I can get the metric of the queue, not interact with it.
The difference with the Azure Portal metric is that this one directly checks the queue itself and not uses Azure Monitor.
Thanks for reading,
Tom.