Announcing Promitor 2.0
Bringing Azure Monitor metrics where you need them.


More than one year ago, Promitor v1.0 was released that introduced Helm deployments, our runtime YAML, support for bring-your-own labels and increased its supported scrapers to 10.
Since then, we’ve only been adding more scrapers & features and our Promitor community has grown and people are starting to contribute back - I cannot thank you enough for this! 🙏
It’s been great to work with the community to learn how Promitor is being used, what people would like to have in the product and how they are adopting it.
Today, we are taking a next step for Promitor with our v2.0 release which introduces some major new features.
Bringing Azure Monitor metrics where you need them 🚀
Promitor was designed to allow users to scrape Azure Monitor metrics and make them available to Prometheus, but why stop there?!
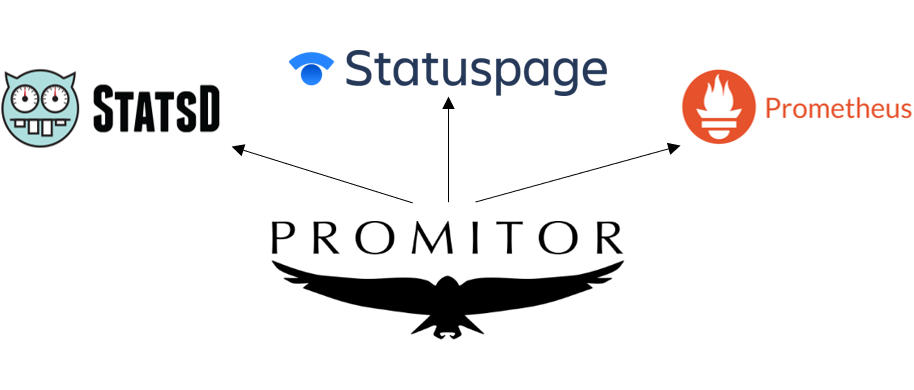
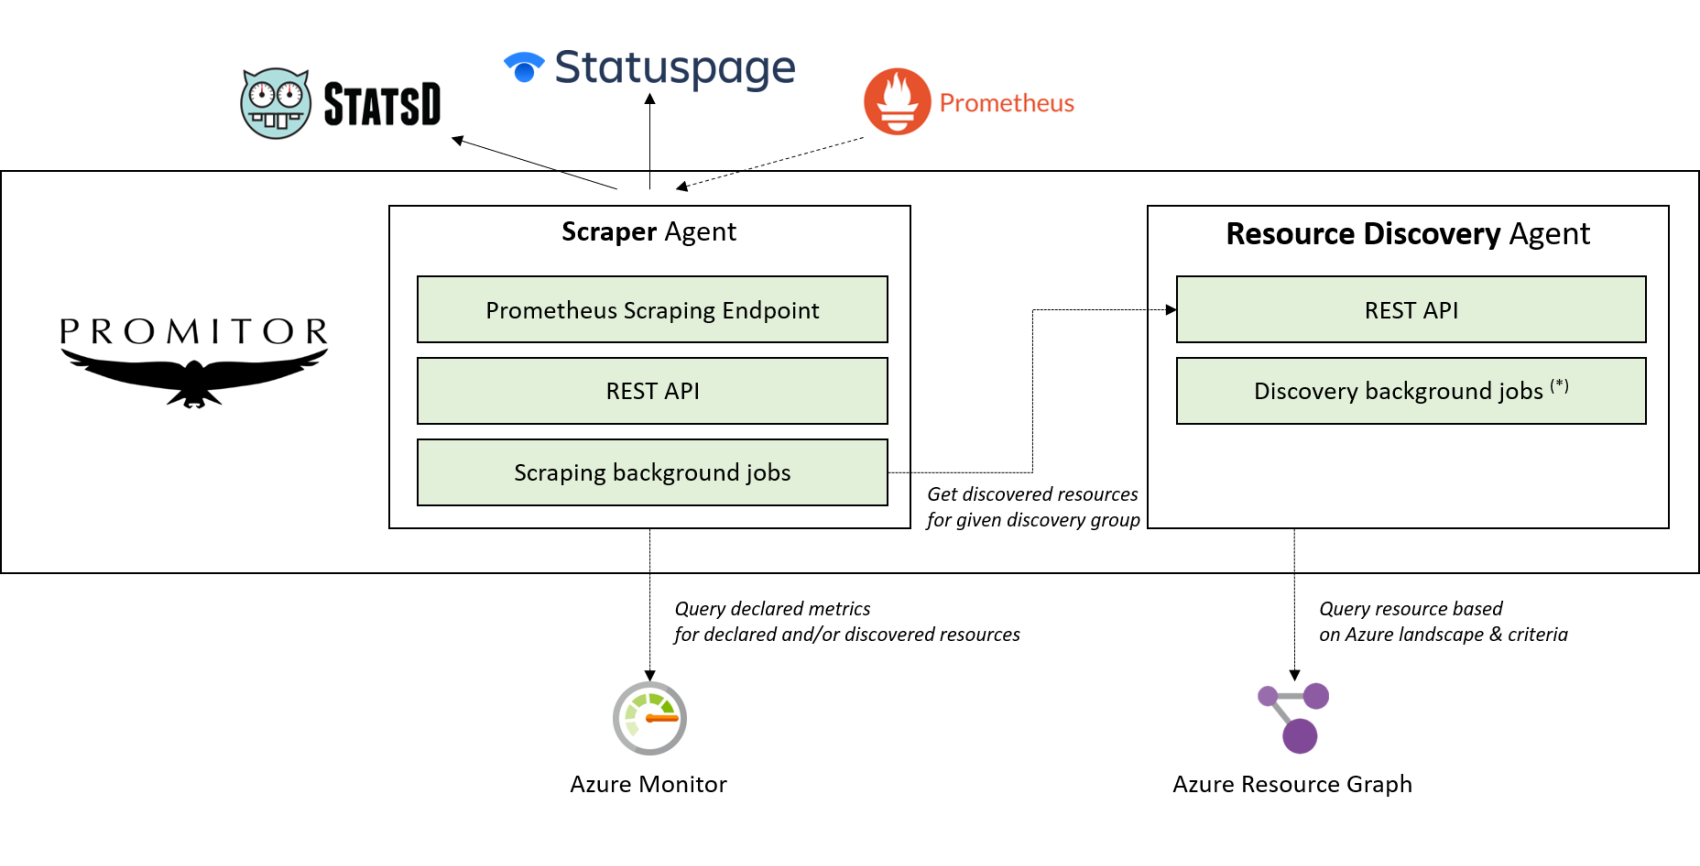
As of v2.0, we allow you to use one or more metric sinks allowing you to bring Azure Monitor metrics where you need them! As from now, users can now surface those metrics in either Prometheus, StatsD and/or Atlassian Statuspage with just a configuration change.
Under the hood, our Promitor Scraper agent will query Azure Monitor once for all your declared metrics and push them to those metrics in a pluggable way.
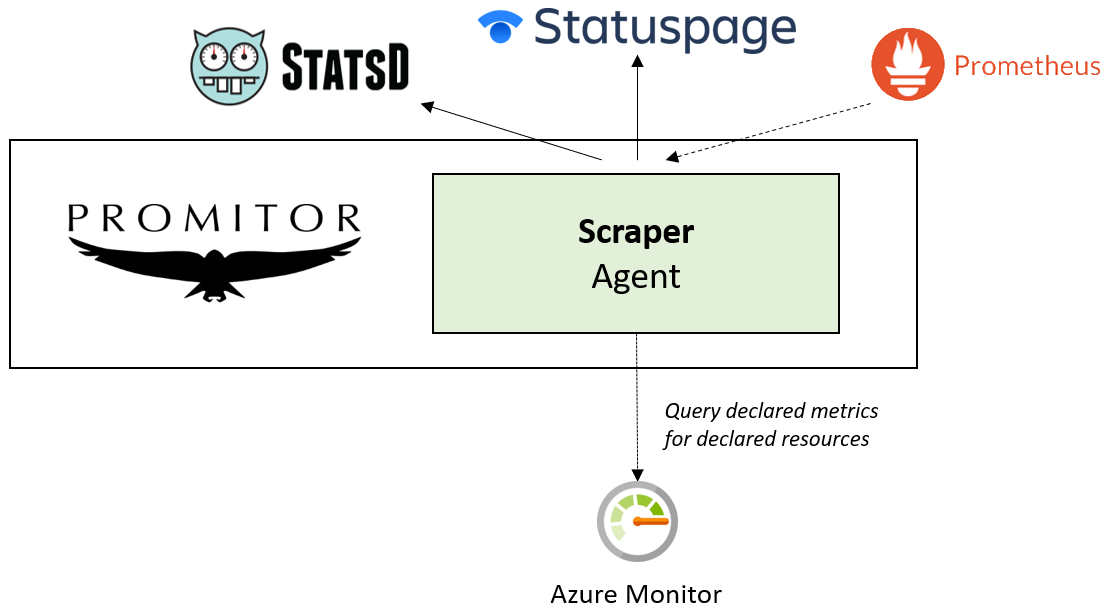
This allows you to reduce the queries on Azure Monitor to avoid hitting throttling limits, while still being able to use the metrics in one or more places.
Do you want to see a new metric sink? Let us know and we can easily add it!
Automatic resource discovery with Azure Resource Graph 📡
Our focus with Promitor was to leverage metrics-as-code where you would define all the metrics you want to have, what Azure Monitor metric we need to query and what Azure resources we should target.
This is a very nice way of defining metrics, until you have too many of them. Next to that, if your Azure landscape is growing rapidly or very dynamic where resources are constantly added/removed by other teams it is hard to keep up.
We’re thrilled to announce our new automatic resource discovery which is built on top of Azure Resource Graph, their cloud-scale resource querying service.
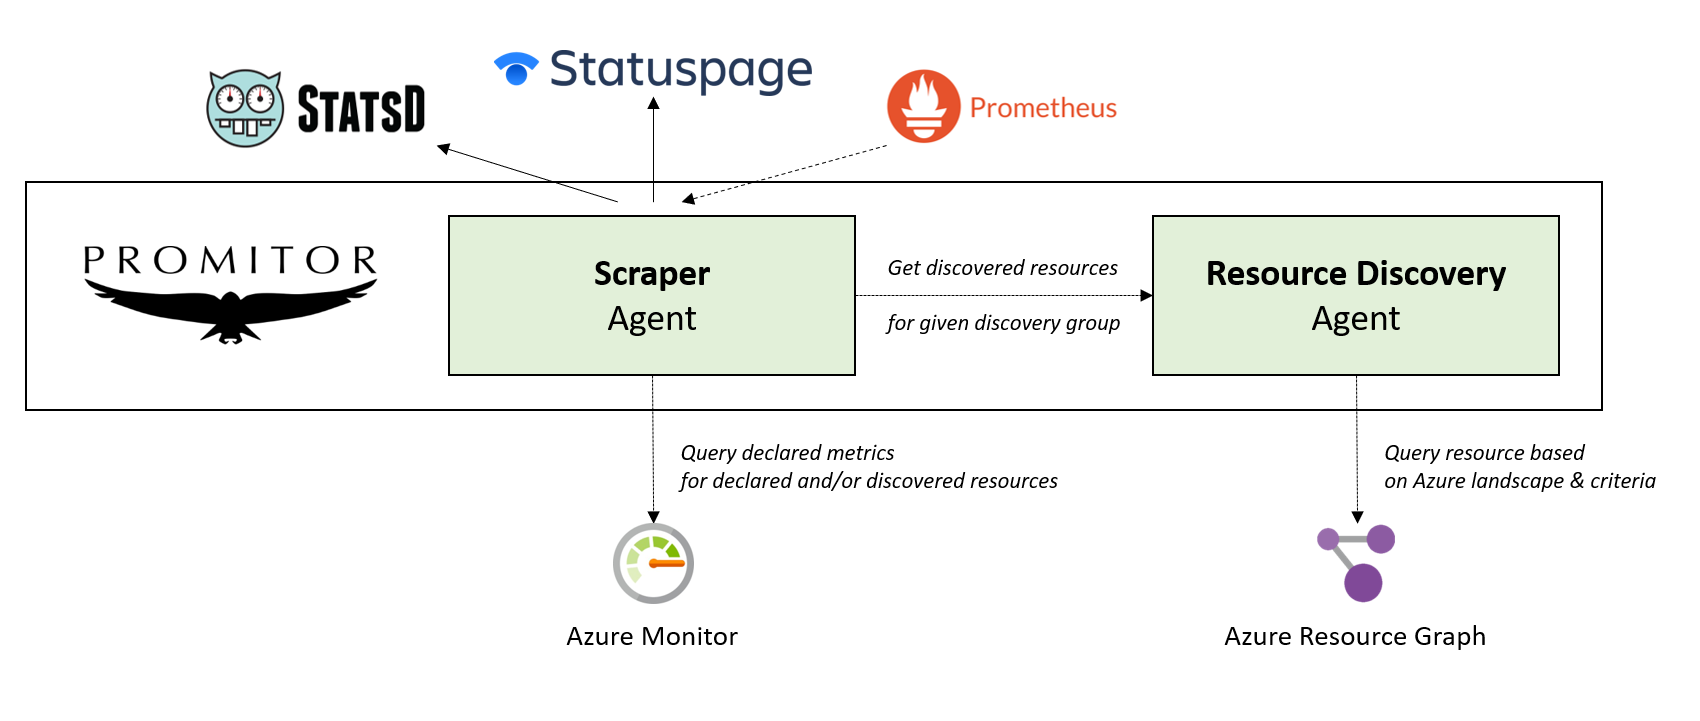
By using our new Promitor Resource Discovery agent, you can declare resource discovery groups which can be used when declaring your metrics in our Promitor Scraper agent. Every resource discovery group is tied to a resource type with the option to filter resources based on subscription, resource group, tags and/or region.
At runtime, Promitor Scraper agent will ask our resource discovery agent to discover the resources for the configured group.
Based on the outcome of that query, it will scrape the metrics for every individual resource and make it available in the configured metric sinks.
Promitor provides a consistent experience with their agents so that they are both exposing REST endpoints to interact with and are using background jobs to do the heavy lifting to reduce latency.
💡 Our Resource Discovery agent is not using a background job yet, but that’s coming in v0.2.0
Automatically scraping metrics with resource discovery in Promitor
So, how do we start automatically discovering resources? Glad you’ve asked!
- We will define what our Azure landscape is and what the resource discovery groups are that will be available. (docs)
version: v1
azureLandscape:
  tenantId: TENANT-ID
  subscriptions:
  - SUBSCRIPTON-ID-ABC
  - SUBSCRIPTON-ID-DEF
  - SUBSCRIPTON-ID-GHI
  cloud: China
resourceDiscoveryGroups:
- name: container-registry-landscape
  type: ContainerRegistry
- name: filtered-logic-apps-landscape
  type: LogicApp
  criteria:
    include:
      tags:
        app: promitor
        region: europe
In this example, we will provide a container-registry-landscape group that will include all Azure Container Registry instances. Next to that, we will use filtered-logic-apps-landscape which includes all Azure Logic App instances with app & region tags.
2. Deploy the Promitor Resource Discovery agent with your declaration (docs)
3. Change your Promitor Scraper configuration to opt-in for resource discovery (docs)
resourceDiscovery:
  host: promitor.agents.resourcediscovery
  port: 88 # Optional. Default: 80
4. Use your resource discovery groups in your declared metrics to scrape (docs)
version: v1
azureMetadata:
  tenantId: TENANT-ID
  subscriptionId: SUBSCRIPTION-XYZ
  resourceGroupName: promitor
metricDefaults:
  aggregation:
    interval: 00:05:00
  scraping:
    # Every minute
    schedule: "0 * * ? * *"
metrics:
  - name: azure_container_registry_total_pull_count
    description: "Amount of images that were pulled from the container registry"
    resourceType: ContainerRegistry
    azureMetricConfiguration:
      metricName: TotalPullCount
      aggregation:
        type: Average
    resourceDiscoveryGroups:
    - name: container-registry-landscape
  - name: azure_logic_apps_failed_run
    description: "Total amount of failed runs for Azure Logic Apps"
    resourceType: LogicApp
    azureMetricConfiguration:
      metricName: RunsFailed
      aggregation:
        type: Total
    resources:
    - workflowName: promitor-automation-github-ci-scraper
    resourceDiscoveryGroups:
    - name: filtered-logic-apps-landscape
5. Deploy Promitor scraper with your declared metrics (docs)
It’s that simple - As you might have noticed, you can use declared & discovered resources together so you can use the approach that fits you best!
Scrape new Azure resources ☁
The heart of the power that Promitor leverages lies in the scrapers that it provides.
Up until today, we provide 24 scrapers allowing you to target a variety of Azure services. With today’s release, we’re happy to share that we are increasing our scrapers to a total of 29 of which 25 (85%) support resource discovery out-of-the-box!
You can now easily get metrics for these new scrapers:
- Azure Application Gateway (Contributed by @bluepixbe 🎉)
- Azure Event Hubs
- Azure Express Route circuits (Contributed by @bluepixbe 🎉)
- Azure Logic Apps
- Azure Network Gateway (Contributed by @bluepixbe 🎉)
- Azure Kubernetes Service (Contributed by @jkataja 🎉)
We have improved how you can scrape metrics for an Azure Service Bus namespace by allowing you to scrape all Azure Service Bus queues & topics inside the namespace, instead of only for one queue. In addition to that, you can now use dimensions as well if you prefer.
However; because you can now not only scrape queues but also topics we have renamed our scaler to ServiceBusNamespace, instead of ServiceBusQueue. More on this later in our blog post.
But wait, there is more! 🎁
And that’s not just it, we have made a ton of improvements in other areas as well!
First, we have made our startup & validation process more user-friendly and robust allowing you to have better log entries, removed noise and added more validation to fail fast. Thanks to Adam Connelly, Promitor will now give suggestions for misconfigured fields in your configurations allowing you to fix them more easily.
We’ve improved how you can operate Promitor and will continue to invest in this area. For example, you can now use our new system API endpoint to get information about our runtime which includes the version of Promitor that you are running today. Next to that, we are including a X-Version HTTP header in all responses that surfaces that information as well.
Next to that, we’ve improved our health probing so that you can choose whether or not you want to verify Promitor’s dependencies. By default; it will return an OK when the agent is running which is ideal for Kubernetes probes, but you can get more detailed information.
💡 Keep in mind that this might impact throttling on Azure services given you’ll consume them for every health check. That’s why we recommend to only include it if you don’t probe very often.
We’ve added a bunch of features to our Helm charts as well so that you can now control how readiness & liveness probes should be configured. Next, you can now opt-in to expose Promitor through an internal load balancer and/or expose it through a DNS endpoint when using Azure Kubernetes Service.
Our artifacts have a new home 🏡
We want to bring our Promitor artifacts as close to you and make it easier to discover and use them. That’s why we’ve moved both our Docker images & Helm charts to a new home!
Moving our Helm charts from promitor.azurecr.io/helm to charts.promitor.io
Promitor allows you to install our agents through our Helm chart registry on promitor.azurecr.io/helm. Unfortunately, Azure Container Registry has dedicated URLs that pinpoints the Azure Container Registry instance.
Because of this, we are introducing a new Helm chart registry that is fully open-source on GitHub and available to be used on https://charts.promitor.io.
We have migrated all our current Helm charts to our new registry to ensure continuity. Our old chart registry will be available until 31st of March 2021 after which it will be deleted.
Learn more about it in our Helm chart registry update or join the discussion.
Migrating to our new Helm chart registry
- Remove your current Promitor Helm repo
❯ helm repo remove promitor
"promitor" has been removed from your repositories
- Add our new Promitor Helm repo
❯ helm repo add promitor https://charts.promitor.io/
"promitor" has been added to your repositories
- Update your Helm repos
❯ helm repo update
Hang tight while we grab the latest from your chart repositories...
...Successfully got an update from the "promitor" chart repository
Update Complete. ⎈ Happy Helming!⎈
Moving container images from Docker Hub to GitHub Container Registry
Our Docker images are now available on GitHub Container Registry allowing you to more easily find them and become part of our Promitor repo on GitHub.
With this move, it improves how we manage Promitor but also avoids users from being impacted by the new Docker Hub throttling or images being removed due to the new retention.
As part of this, we have moved all existing Promitor images to GitHub Container Registry allows you to standardize on the new container registry and newer versions will not be published to Docker Hub. If you are using our Helm chart this will not impact you.
Learn more about it in our Docker Hub deprecation notice or join the discussion.
What was removed? 🌄
While we strive to be backward compatible with all releases, it can not always be avoided. Over time, we have deprecated a few features or configuration options in favor of newer approaches that are more powerful.
As part of Promitor v2.0, we are removing these deprecated items to clean up our legacy and focus on the new approaches only.
Here is an overview:
- Helm v2 (deprecation notice | discussion) - In November 2019, Helm v3 was announced which marked the end of Helm v2 and is now no longer supported. Because of this deprecation, Promitor will only publish Helm v3 charts and no longer support v2 deployments out-of-the-box. They might still be working but won't be our focus for versions as of Promitor 2.0.
- Legacy Prometheus Configuration (deprecation notice | discussion) - Promitor now uses a unified metric sink configuration approach which provides a Prometheus sink to be aligned with the other sinks.
- Swagger 2.0 (deprecation notice | discussion) - OpenAPI v3.0 has been released in 2017 which is the new industry standard for documenting APIs.
- Swagger 2.0 UI - (deprecation notice | discussion) - OpenAPI v3.0 has been released in 2017 which is the new industry standard for documenting APIs.OpenAPI 3.0 UI is now the only supported way to browse our APIs.
- Service Bus Queue Scraper is replaced by our new Service Bus Namespace scraper because it supports scraping both queues & topics.
Are you impacted? We provide a migration guide to help you use the latest and greatest or feel free to join the discussions.
What’s next? 🧭
While we are super excited to release Promitor 2.0 we have a lot more great ideas to turn into new features!
We want to make sure that you can run Promitor by using your security standards.
That’s why we are planning to support Pod Identity (issue) and allow you to bring secrets from your secret stores including Azure Key Vault & HashiCorp Vault.
We are only introducing our resource discovery today, but want to make it even better:
- Optimize discovering resources by using background jobs (issue)
- Provide support for excluding resources during discovery (issue)
- Provide insights on our discovery itself, for example by surfacing throttling information (issue)
- Provide support for automatically discovering new resource types
For our scraper, we are planning on delivering more powerful metrics:
- Provide the capability to include Azure Tags as dimensions (issue)
- Provide support for scraping other Azure services (issues)
- Provide integration for new metric sinks
- Make it easier to fix misconfigured Azure metrics (issue)
Last but not least, we want to make Promitor deployments more robust and improving how to run them. That’s why we’ll improve how multi-instance Promitor deployments work so that information is shared instead of scraped n times (issue).
Next to that, we are evaluating adopting the Operator pattern allowing you to create metrics as Kubernetes resources, instead of a big YAML file. Please let us know in our issue what you think.
But let us know what you want! Do you need a specific scraper? Feel free to create a feature request or share an idea on GitHub!
Conclusion
It took me a while due to Covid but we’re happy to finally release Promitor 2.0! It’s been a great ride and want to thank everybody who has contributed back to Promitor and help improve the product 🙏
A big thank you for our current users who are now listed on our website,if you are using Promitor as well - Don’t hesitate to reach out to become a listed user!
A huge thank you to my GitHub Sponsors for supporting me in maintaining Promitor and making sure I can keep working on it! Without them, it would not be possible.
Want to join the conversation? Don’t hesitate to head over to GitHub Discussions and share how you are using Promitor, what ideas you have, or ask questions!
Thanks for reading,
Tom.